Introduction
Cardiovascular disease is a broader term for various diseases of the cardiovascular systems. One of them is the acute cardiac failure where the native circulation is unable to achieve hemodynamic stability with sufficient cardiac output and oxygen delivery to the end organs. In these circumstances, extracorporeal circulatory support systems maintain complete cardiac output through femoral venous and arterial vascular access [1]. In other words, extracorporeal life support (ECLS) temporarily takes over the function of the heart in the way of actively draining venous blood and circulating it through an external system with a centrifugal pump and a membrane oxygenator, where it is oxygenated, decarboxylated and the arterial blood is returned to the patient, allowing sufficient flow and thus adequate blood pressure. Despite the gratifying advancements in ECLS and its increased utilization, the procedure remains concomitant with a substantial mortality rate. The contemporary challenge in ECLS is the cannulation which involves the issue of retrograde flow towards the native circulation, characterized by elevated energy transmission. The countercurrent and retrograde extracorporeal flow imposes an increased afterload on the left ventricle, necessitating comprehensive investigation and potential intervention for optimal ECLS support and patient outcomes [2, 3]. However, the impact of ECLS to the wave propagation and arterial impedance of the failing native circulation during ECLS has not yet been discussed in detail. This raises the question of possible negative hemodynamic effects like afterload changes or left ventricular distention caused by ECLS [4, 5]. The underlying mathematically complex phenomenon of these hemodynamic changes require wave intensity analysis as well as the wave separation analysis methods [6-10]. Both methods allow investigating flow phenomena like wave interference, impedance measurements and spatial flow directionality. In principle, both methods will eventually lead to conclusions and mutually uphold the others, yet in practice the two methods are very different. Although these methods may be applied at the bedside, the clinical context allows no adjustment of acute cardiac failure. Therefore, only in vitro methods are capable of systematic investigation with continuous and fast instantaneous adjustment of all stages of cardiac failure. Hydraulic cardiovascular mock loops which comprise the complete arterial and venous vascular tree and paracorporeal assist devices may be used for assessment of these complex phenomena and could show negative flow interactions despite normal hemodynamic conditions [3, 11]. However, as previously described, there are alterations to the hemodynamics in the aorta caused by the application of ECLS that have not been further investigated in more details. Wave analysis and wave separation are capable of capturing underlying wave reflection as well as forward and backward pressure waves beyond normal hemodynamics. The assumption of these changes lies in the energy fluctuation caused by the countercurrent flow source originating from ECLS and opposite to the main native circulation flow. It is believed that the total amount of energy carried by the retrograde flow from the ECLS is substantially larger than the energy from the compromised cardiac output. Beside the unknown amount of energy of the two different flow sources, the ECLS flow may also markedly contribute to increase flow waves and this mass transportation phenomena has not been investigated so far. We, therefore, investigated flow phenomena in the time and frequency domain to mathematically explain energy and flow associated afterload changes during ECLS.
Material and Methods
This research is an in vitro feasibility study based on a validated life sized mock circulatory loop (MCL) developed by the EMPACS (Exploration of the mixing phenomena during interaction of internal and external circulations) team from the University Hospital Giessen [11]. This cardiac simulator is equipped with (1) a cardiac module representing the left and right ventricle driven by two pulsatile paracorporeal 80 ml ventricular assist devices (Excor, Berlin Heart GmbH, Berlin, Germany), and (2) a vascular module which consist of 2 flexible life-sized silicon dummies of the complete major arterial and venous tree with an elasticity module of 3.1–3.4 N/mm2 at room temperature, allowing instationary flow behavior similar to the native circulation. It further consists of resistance elements, flow and pressure sensors and validated compliance chambers for the peripheral and pulmonary circulation allowing continuous adjustment of all stages of normal circulation or complete cardiac failure. [12]. To allow extracorporeal support, an ECLS was connected femoro-femoral to the MCL.
The research methodology in this project will be discussed in detail starting from data collection from the test setup, followed by data processing using filtering to the application of the 2 methods and will then be quantified.
Data Acquisition
In this section, the data acquisition process will be discussed in detail, as the acquired data becomes a crucial element for subsequent data processing and analysis. The data collected for this particular research was conducted in vitro with the EMPACs MCL where the signals were retrieved from mounted sensors that are simultaneously recorded in real-time using MAD App, a special software specifically deployed to record signals on the MCL. The sensors used in this research are a common clinical pressure sensor (Combitrans; B-Braun, Melsungen, Germany) to measure blood pressure and a flow sensor (Sonoflow CO.55 260; Sonotec GmbH, Halle (Saale), Germany) to measure flow rate in large blood vessels, precisely on the descending aorta. While several pressure sensors will also be mounted on several places such as the radial artery, vena cava, left lung, and right lungs to monitor vital pressure on the simulator to replicate the desired real-life patient condition. In addition, the flow rate of the upper and lower extremities will be monitored using a transit time flow sensor (H9XL, Transonic, Ithaca, USA) for the same purpose.
Stages of Cardiac Function under Investigation
(1) Normal cardiac function without extracorporeal support, with a cardiac output at 3.5–4 l/min and an arterial pressure of around 105/75 mmHg, indicating normal conditions.
(2) Cardiac failure requiring ECLS, with a cardiac output at 2 l/min and an ECLS flow of 3 l/min, resulting in a mean pressure range of 60–80 mmHg and a pressure amplitude of 5–15 mmHg, indicating recovery condition 1. These stages were based on previously published data for construction, validation and investigations with the MCL [3 ,11].
Data Filtering
In the signal acquisition from a sensor, it is extremely typical for noise and other artifacts to be recorded, causing the topography signal to be rather unsmooth. The raw signal which is full of noise has to be filtered using a type of filter that gives a more refined topography signal while maintaining the original signal characteristics. The pressure and flow signal data obtained in this study is also considered to be a non-smooth signal, which makes the digital filtering process reasonably necessary and hence the Butterworth filter will be applied to the signals. This is due to a characteristic of this filter that maintains the amplitude response while minimizing signal distortion [13].
To facilitate the analysis of the spectrum and the creation of a standard signal environment, the algorithm for determining the single mean wave will be applied, considering that the acquired signals are quasi-stable and adequate. The characteristics of the pressure and flow signals obtained are periodic signals giving the signals peaks and valleys. This can be advantageous for calculating the mean wave as these points can be used as cutoff points in determining the cycle in a periodic signal, which is the first essential step in calculating the mean wave, where in this study the valley point will be used as a benchmark point. The valley points can be found using the findpeaks function on an inverted signal, where a cycle can be defined as the interval of two consecutive valley points. These cycles will then be interpolated using cubic spline interpolation which allows for an even distribution of data within a normalized time range from 0 to 1. The average waveform of the interpolated cycle signal can finally be determined by taking the average value of each interpolated point, in addition the standard deviation variation of this average waveform can also be easily obtained and visualized thus presenting the stability of the cycles in the signal.
Data Assessment
Wave Intensity Analysis
Wave intensity analysis is a method that aims to look at the composition of forward or backward and compression and decompression forces on a wave [14]. In addition, this section is part of the mathematical approach that will be used for data assessment. In principle, the definition of wave intensity (I) can be described mathematically as follows:
![]()
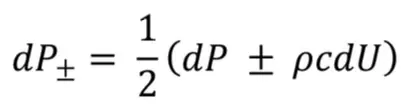
Where dP is the derivation of the pressure signal or pressure change and dU is the velocity change in the wave, whereas dP and dU are successive wavefronts consisting of forward waves marked by subscript ‘+’ and backward waves marked by subscript ‘-’ that are associated with each other and can be decomposed as shown below:
![]()
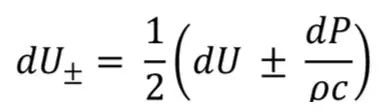
and
![]()
By using the water hammer approach, the mass and momentum conservation in each wavefront can be obtained as in the following [14]:
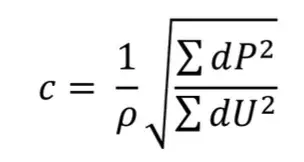
or equivalent
In the context of the above equation, p symbolizes the densityof blood and c is the local wave speed that can be achieved from the measured pressure and flow signals and is the sum of the square method yields over one cardiac period [15]:
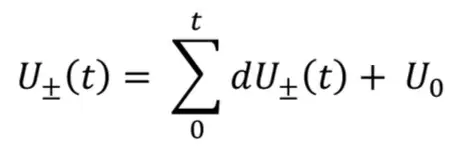
The summation of the forward and backward wavefronts can be transformed back into measured pressure and flow in time domain [14]:
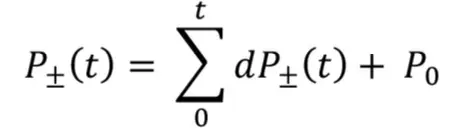
and
Wave Separation Analysis
Wave separation analysis or also known as impedance analysis is a method of wave analysis based on a complex mathematical approach by decomposing the signal into its harmonics with a certain frequency [16]. In this research, the two signals that have been acquired, i.e., pressure and flow signals, will be decomposed into their respective harmonics, where the acquired signal that was initially a signal in the time domain will be converted into the frequency domain. This can be represented by separating the signal into sinusoidal components at different frequencies and the outcome is an information about the amplitude and phase of each frequency component of these signals. This concept can be interpreted using mathematical equations on a discrete signal x[n] where n is the total number of samples, but such mathematical computations require complex computations, and in practical implementation, a FFT algorithm is favored [17].
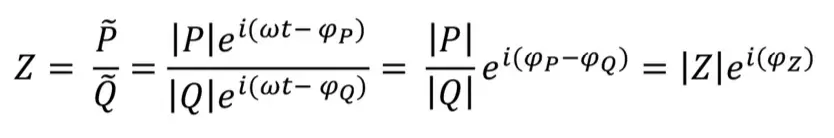
The results of this algorithm, which are the spectrum of amplitude and phase, will be assessed with the fundamental reference [16]. In the context of impedance analysis, this could be mathematically translated that the impedance modulus as the ratio of the corresponding harmonics with their respective phase angle for each frequency, where the impedance will be calculated using this following equation [18]:
The impedance modulus would also represent the input impedance of the arterial system (Zin) which will eventually be combined with its impedance characteristics incorporated by the gradient on the early systole, allowing the reflection coefficient to be written as follows [16, 18]:
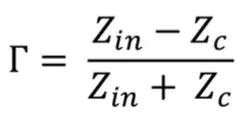
Where Zc is a characteristic impedance that can be seen in the average amplitude of the static FFT spectrum [18]. The acquired blood flow and pressure signals consist of forward and backward propagating components due to the arterial properties which differ from a rigid pipe, allowing the blood to bounce back towards the heart. However, in the acquired signal, these components cannot be explicitly perceived, and using the harmonic decomposition of the signal, the forward and backward propagating components in the frequency domain can be quantified [18]. Using the intrinsics relation, both propagating components can be separated using the equation below:
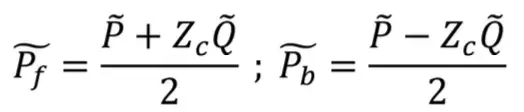
Whereas P is the summation of the pressure from the forward propagating pressure wave Pf and the backward propagating pressure wave Pb [18]. The composition of the forward and backward pressure waves will then be calculated from the equation above as a series of signals in the frequency representation, requiring the reconstruction of the two propagating signals to be restored to the time domain or the original signal using the Inverse Discrete Fourier Transformation (IDFT).
Results
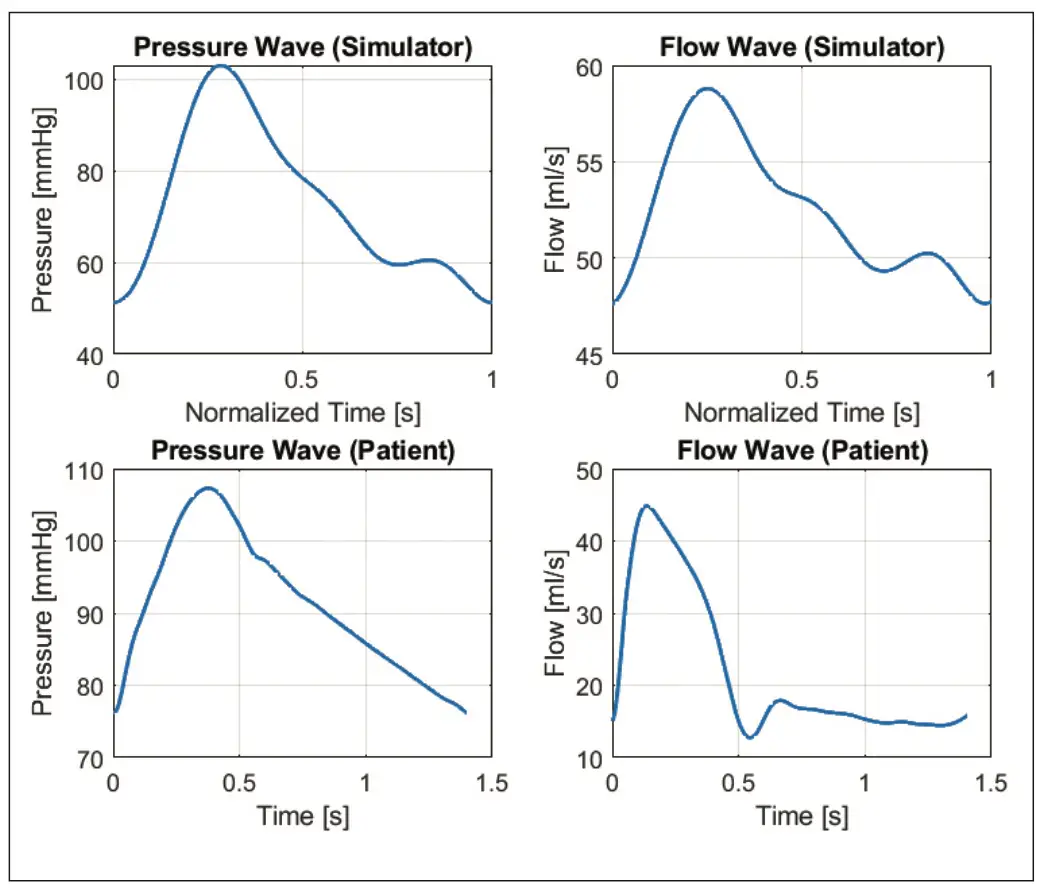
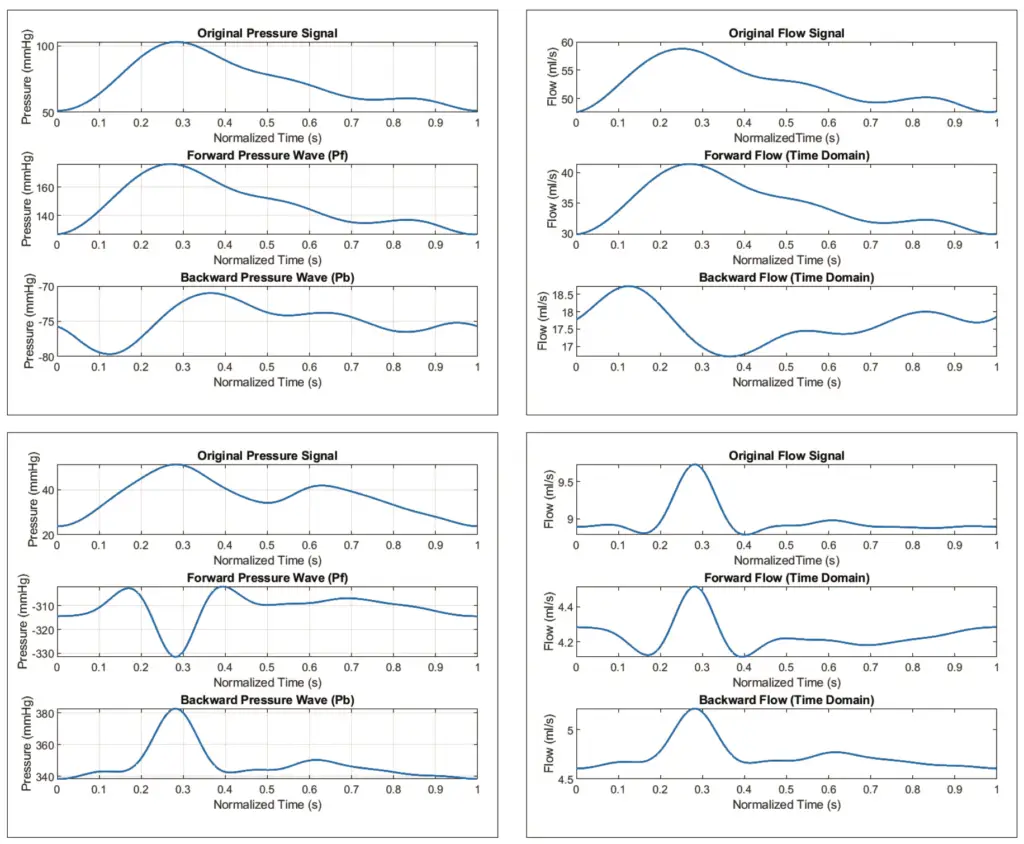
As described in the above section, the data collection will be carried out in vitro on MCL (Mock Circulatory Loop) using EXCOR IKUS as a pumping device. This simulator has been validated to be able to replicate macrocirculation in a condition that is nearly comparable to real patients with some limitations. Below are the filtered and normalized flow and pressure waves retrieved from the MCL compared to single flow and pressure waves from a real patient taken from University of Ghent (personal communication of the authors). An in-depth comparison of the signals with these 2 different environmental sources will be discussed later.
Wave Intensity Analysis
In order to carry out the wave intensity analysis method, the filtered and normalized data where the units of pressure and flow are presented in mmHg and l/min, must be converted to Pascal (Pa) for pressure and to velocity units of m/s for flow data. Both wave signals are also classified as time-varying signals, which allows the derivative of each signal in the interval dt to be calculated, resulting in dP and dU as the derivatives of pressure and flow, respectively. The product of these two derivatives is used to define the wave intensity dI. Similar to the above, mathematical processing will be carried out for each clinical condition and the results will be displayed in the figure below.
waves from the real patient
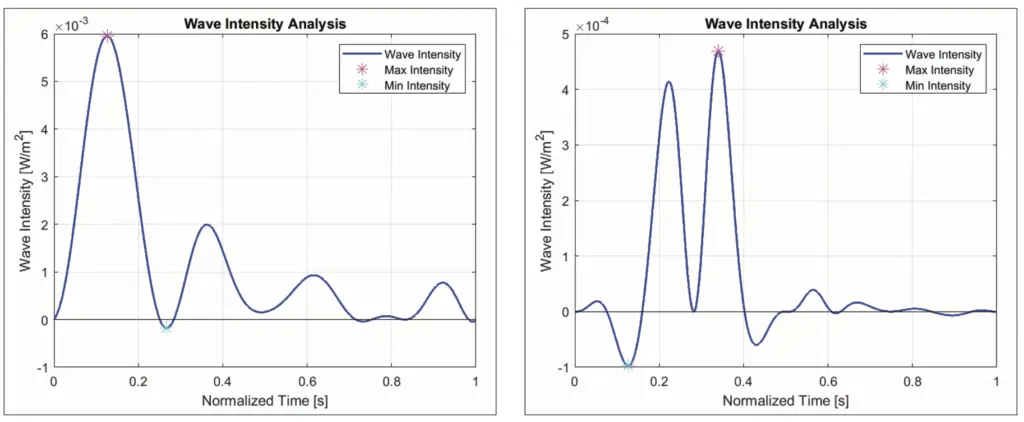
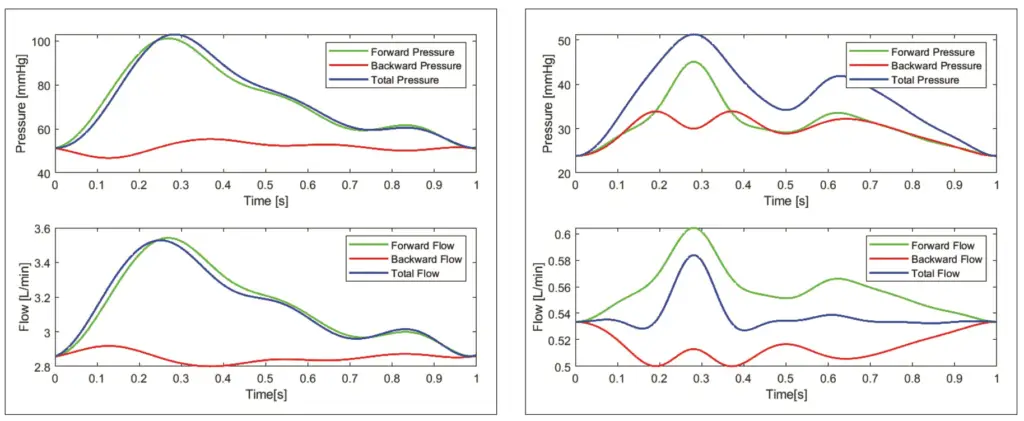
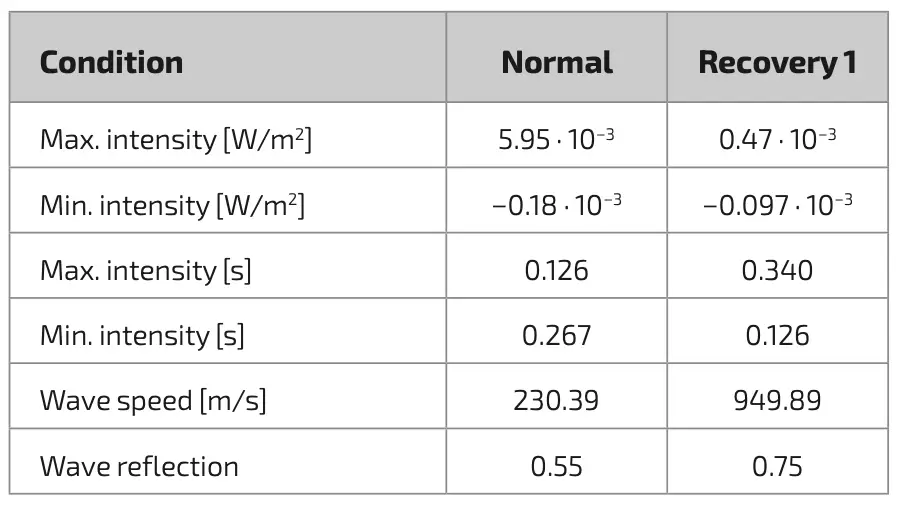
In figure 2, it can be seen that the wave intensity is illustrated in correspondence with the existing literature foundation, the area above the 0 line covered by the wave intensity indicates forward wave compression while the area below the 0-line indicates backward wave compression, which is characterized by positive curves and negative curves bearing the highest and lowest points of the wave intensity itself. The values such as maximum and minimum intensity and the time of occurrence will be recorded as well as data extraction from the visual wave intensity or the product of the two derivatives of pressure and flow signal, will be compiled into table 1 that will simplify further quantification of the data. Wave intensity analysis does not only propose forward and backward compression analysis, but using the equations of 4 and 5, it allows each forward and backward wavefront to be identified, where each wavefront can be transformed back into forward and backward waves in the original time domain. See figure 3 for a detailed overview. The wave forward and wave backward changes obtained using the wave intensity analysis technique provide insight into the mechanical dynamics of the artery as well as the nature of the vascular resistance that affects flow, which can be determined using the separated waves. However, this wave decomposition is also highly dependent on the accuracy of the wave speed determination, which is one of the essential components in the basic mathematical calculations [18]. Therefore, these components will be shown in table 1.
Wave Separation Analysis
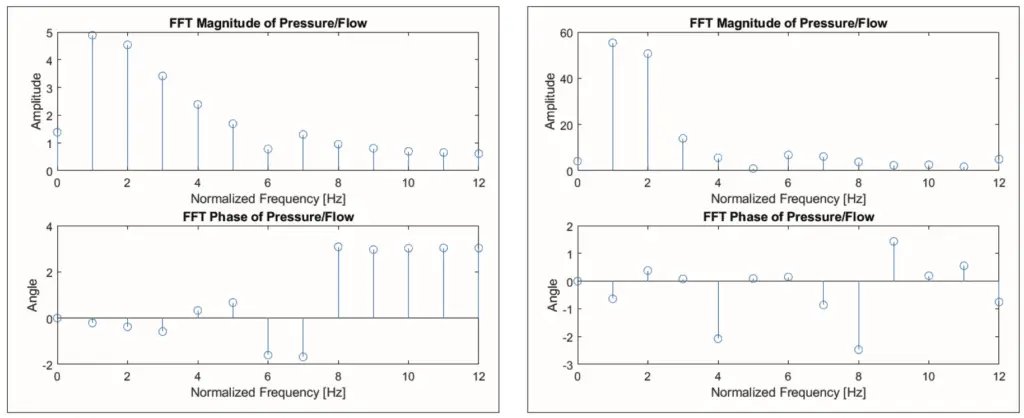
In this section, we will review another method; this method is the wave separation analysis that has been described in the previous sections. The acquired main signal that will be modelled here will be the same signal with the same filtration and interpolation process as described above. Performing an FFT on these signals and subsequently applying equation 9 will generate the impedance spectral, which has two datasets: the magnitude, and phase shift of the pressure and flow in the frequency domain. The ground frequency of these signals must match the highest magnitude – given that this is a normalized signal, the highest magnitude will always be within 1 Hz.
The dataset components of the FFT for each signal can be further elaborated to examine the separation of the forward and backward waves using equation 11, where the separation of these waves will be displayed in the time domain, hence the IFFT will be required in this equation, where the result can be seen in figure 5.
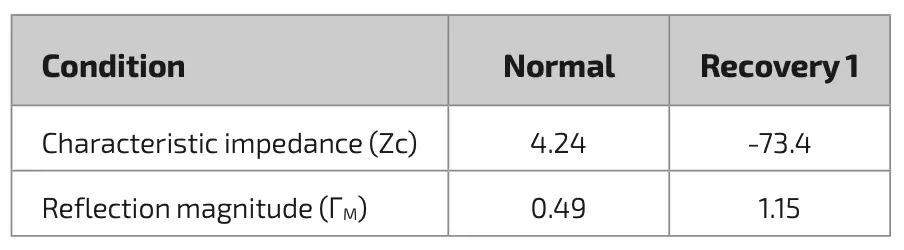
The characteristic impedance required for the process of implementing this wave separation method will be calculated using one of the approach that has been provided in some literature, namely pressure-flow relationship approach, where the characteristic impedance will be illustrated as the ratio in the early systole which in this study will approximately happen between 100–150 ms and the results are outlined in table 2. Additionally, the reflection magnitude or ΓM will also be derived in this table by extracting the ratio of both maximum separated pressure waves.
Discussion
The mean wave implementation is employed to obtain a single beat from the recorded signal. This single beat is believed to obtain an accurate and efficient result rather than continuous beats that can contribute other significant features in the essential properties of the wave separation analysis, therefore the normalized mean wave for pressure and flow waves for all clinical conditions will be utilized as the main signal source. The mean wave method applied is a signal trimming technique of each cycle based on its lowest point, followed by interpolation. These mean waves from the cardiac simulator were compared with the waves from a real patient under normal conditions, in order to determine any potential variations that may affect further analyses. In figure 1, the illustration of the pressure and flow signals from the cardiac simulator has been set horizontally, and aligned below it is the signal from the patient which should also be noted that these two signals originated from adjacent sources in the major aorta. Despite the validation of this simulator, it still has some limitations in terms of feedback and anatomical features, which can be observed in the morphology of the two flow signals [11]. During the systole process, which is characterized by an incline of blood flow in the aorta, the rate of increment is slightly different between the simulator and the patient where the patient’s rate of increment is slightly more abrupt with a sharper peak followed by a rapid decline in the flow and followed by a fairly constant flow rate in the diastole process, whereas in the simulator, the blood flow rate in the simulator experiences a gradual decline in the diastole process until the end. The main reason for this is due to the lower compliance in the simulator resulting to a less distinctive Windkessel effect, where the high compliance value of the major artery wall serves as an energy reservoir to prevent flow spikes during cardiac pumping. The Windkessel effect is also strongly associated with the relaxation phase of the heart, the pressure drops will be carried over by the constricted aortic wall to maintain steady blood inflow and thus the signal appears as a constant flow. Nevertheless, the signal from this simulator will remain to be used for further analysis along with certain limitations.
The results of the time domain approach, commonly known as wave intensity analysis, aimed to capture the interaction between pressure waves and blood flow in the circulatory system, will be discussed in depth as follows. The mean waves originating from the cardiac simulator were processed using this method which results in a description of how the blood waves move through the artery or the changing rate of wave energy along with the direction of flow in this system called wave intensity, and the results are illustrated in figure 2. While the result of wave intensity looks similar when compared to the other publication on wave intensity, there is a discrepancy as there is a significant forward compression that is not a forward expansion wave or end of ejection wave formed after the major forward compression noted in table 1 as maximum intensity. This is again based on the relative inadequacy of an energy reservoir in the aortic vessel [19]. However, in figure 2a, the major backward compression wave, which is a sign of energy reflection heading back towards the heart, is also observed, despite being minimal at 0.27 seconds.
Intriguingly, the recovery 1 condition in figure 2b shows a distinctive morphology where the maximum value recorded in table 1 is 92 % lower than the maximum intensity in the normal condition. In addition, the minimum wave intensity value also appears somewhat low when compared to other clinical conditions, although if the maximum and minimum wave intensity values in recovery 1 condition were compared, the minimum value has a 20 % share of maximum value. Moreover, figure 2b also shows that the backward compression wave occurs earlier than the forward compression waves and it can also be observed in table 1 that the timing of these two compression waves is reversed with regards to normal clinical conditions. According to the observation, this is due to the retrograde countercurrent flow coming from ECLS, where in figure 3b, a major net energy in the backward wave at the 1.26 second can be identified that managed to suppress the forward left ventricular wave significantly, leading to a shifting of the maximum intensity. Furthermore, due to the constant retrograde flow from ECLS, there is a rise in the second forward wave which is greater than the first forward compression wave, this can be assumed as a description of the afterload of cardiac work caused by ECLS application, however the backward net energy in recovery 1 condition is not greater than the forward energy, but almost equal which is not seen in the normal conditions in table 1. Through the implementation of this method, the afterload on the heart due to the application of ECLS also has a magnitude as listed in table 1, which can provide insight for future research to compare several ECLS parameters to the afterload compression caused by its application, where high and continuous afterload may lead to myocardial fatigue due to high energy required by the heart muscles and this can also cause left ventricular (LV) hypertrophy and complications in the cardiovascular system [20].
This method also offers the separation of waves into forward and backward wavefronts that provide a real illustration of the vascular dynamics in the cardiovascular system. Figure 3a shows the lack of retrograde flow and pressure towards the heart due to the fact that the cardiac simulator is not equipped with Windkessel effect simulation. However, in recovery condition 1 in figure 3b, the installation of ECMO has a significant effect on retrograde flow and pressure, where these are pure cardiac and ECMO circulations regardless of the pressure reservoir of the aortic wall on the simulator. This leads to speculation that the retrograde ECMO application in the simulator equipped with a higher compliance compared to a real patient is likely to cause a higher net compression than the LV compression. This wave separation incorporating time domain analysis is highly effective but also strongly dependent on the value of the local wave speed c, which can be estimated using PU loop method, PWV method or sum of square method [21]. In this study where the data recording was done at a single site and in order to minimize the deviation, the sum of square method is the most desirable option, where the derivatives of the two acquired signals are applied and due to the limitations mentioned, the value of the wave speed appears to be much larger than the normal wave speed (see table 1) [15]. The implementation of an analysis method that aims to examine the dynamics of waves in the cardiovascular system in the frequency domain is often referred to as impedance analysis, where this method is firstly introduced to separate the forward and reflection waves. The quantification process in the frequency domain is written in equation 9 and produces the spectral impedance between pressure and flow waves at each frequency, which describes the characteristics of the entire cardiovascular system. Firstly, the impedance under normal conditions of this simulator depicted in figure 4 will be quantified and compared with the available source. The similarity can be observed that the highest amplitude is located at the ground frequency which indicates the dominance of the resistance system, where the coupling between blood flow and pressure is strongly correlated [22]. In addition, this low frequency system also has a slight capacitance property as depicted in the lower part of figure 4a concerning the phase shift, which is based on the basic theory that ϕZ with a value below 0 is considered as a capacitive behavior system [18]. This capacitive nature of the system remains intact towards intermediate frequencies, however, it should also be pointed out that the phase shift is noticeably smaller than in the available source, this is mainly due to the fact that the vascular wall in the simulator has a low compliance resulting in a less distinctive Windkessel effect observed in normal patient; this is also observed in the results of the time domain method. In figure 4b, the magnitude experiences an amplitude decay which is somewhat similar to exponential decay and illustrates that at high frequencies, approximately above 6 Hz, the magnitude decreases and approaches 0, but the change in phase is seen to increase in its value and appears to be constant at 3 radians which indicates that the dominance of this system is inertial, where certain pressure build-up is necessary to generate the flow [18]. In addition, in normal conditions, the magnitude decline is also shown in recovery 1 conditions (see figure 4b). An interesting feature is that in normal conditions, the maximum magnitude located at the ground frequency is around 4-5 mmHg/(ml/s) while in recovery 1, the impedance magnitude is 10 times bigger, indicating a very high resistance system that may have been caused by the combination of cardiac output and ECLS flow. In the phase shift of the recovery 1 condition, it can also be seen that the inertial properties where pressure buildup is required, appear more often as well as the capacitance properties that appear to be greater than the others, which is notably seen as a normal capacitive value. However, it is necessary to note that the Windkessel function is relatively low in this simulator. Thus, it can be reasonably expected that this might be the effect of the retrograde flow from the ECMO. This could indicate that the energy produced by the retrograde flow is approximately equal to or could possibly even be slightly greater than the native flow of the cardiac output, but this method could not illustrate the magnitude of each energy source.
The implementation of the wave separation method can be further strengthened by the implementation of signal separation where the component impedance characteristic or Zc plays an important role. This method of determining impedance characteristics can be accomplished using two methods where method one is taking the magnitude of the high frequency in the spectral impedance in figure 4 and the pressure-flow relationship where Zc will be obtained from the gradient ratio of pressure and flow in early systole [6]. Figure 5 and table 2 are the results of the implementation of the wave separation method using the characteristic impedance of the pressure-flow relationship. The Zc values in table 2 for normal conditions differ significantly from the literature available on healthy patients [23]. However, the wave separation implementation will still be carried out using the Zc value from table 2. The reflection magnitudes in normal conditions in this method, listed in table 2, also look similar to the reflection magnitudes calculated using the other method listed in table 1. However, in figure 5c and figure 5d, the morphology and amplitude of the signal are significantly different from those in figure 3b, as well as the amplitude of the backward pressure wave, which is very dominating, indicating the presence of flow from other sources that may carry a substantial potential source of energy. Although this enhanced method seems feasible for conditions with adequate signal, it can be stated that the enhanced method of signal separation by incorporating characteristic impedance needs to be re-examined.
Conclusion
Based on the extensive analytical work conducted in this feasibility study, where the main objective is to assess different methods for evaluating the application of a countercurrent acting ECLS to the native circulation, it can be concluded that both methods have great potential and are feasible to be adopted. Despite the limitations of this study, both methods are able to show the effects that arise from the application of ECLS, with their different but complementary results. The wave intensity analysis method introduces information on energy transfer changes, where the afterload effect on the heart can be clearly captured by the energy carried by the opposing blood flow from ECMO, forcing the heart to work harder, and if this continues for a long time, it can lead to myocardial distention and delayed recovery. The extension of this method allows the waveform to be segmented to show the contribution of forward and backward waveforms and quantify the vascular reflection magnitude. In parallel, the wave separation analysis method is able to present the dynamics of waves or the relationship between flow waves and pressure waves in cardiovascular in the frequency domain, which will be quantified by the results of data generated in the Fourier transformation process. Using this method, the behavior of the system can be seen where the signal with ECLS attached to the system has a much larger impedance magnitude which indicates a system with high resistance compared to normal conditions. Moreover, this is also confirmed by the phase shift data observed in impedance spectral in recovery 1 condition, where indications of system inertia appear more frequently in the first 10 frequencies. Similar to wave intensity analysis, this method can also separate the signal into its contributing signal, yet in practice this wave separation is quite difficult to perform on inadequate signal waves. Due to the limitation of the anatomical MCL itself that causes alteration of the signal, the determination of some values will also be influenced, however, this was not thoroughly explored in this study due to time and resource limit. Although this study has shown that these two methods are feasible, there are several recommendations that need to be considered in order to enhance the methods that have been outlined, including evaluating the approach of determining characteristic impedance in further depth in order to apply advanced methods of impedance analysis. In addition, since these two methods are able to evaluate the energy transfer rate as well as how the entire system is behaving, new data sets with different ECLS parameters are needed to determine the effects of ECLS on the cardiovascular system in more detail. Nevertheless, by properly mitigating the limitations of this study, this method has great potential to provide a detailed overview of the application of ECLS to the cardiovascular system that has not previously been discussed in greater depth.
Limitations
In this feasibility study on examining two methods for evaluating the effect of the application of an ECLS on the native circulation performed on a cardiovascular simulator, there are several limitations that are considered relevant to the accuracy of the results and conclusions obtained, i.e.:
- Anatomical limitation: the study was performed on a MCL developed by the EMPACS Group that has been clinically validated, where to reproduce the pressure and flow wave has been carried by manually adjusting the MCL driving parameters, which requires familiarity with the model. So it is not uncommon to reproduce the same signal that requires different parameters and may cause irregularities.
- Assumptions underlying the selection of the method used in determining the value of the characteristic impedance.